If you’re interested in building out a homelab Kubernetes cluster this year, I want to share with you the first 7 apps you need to install in it.
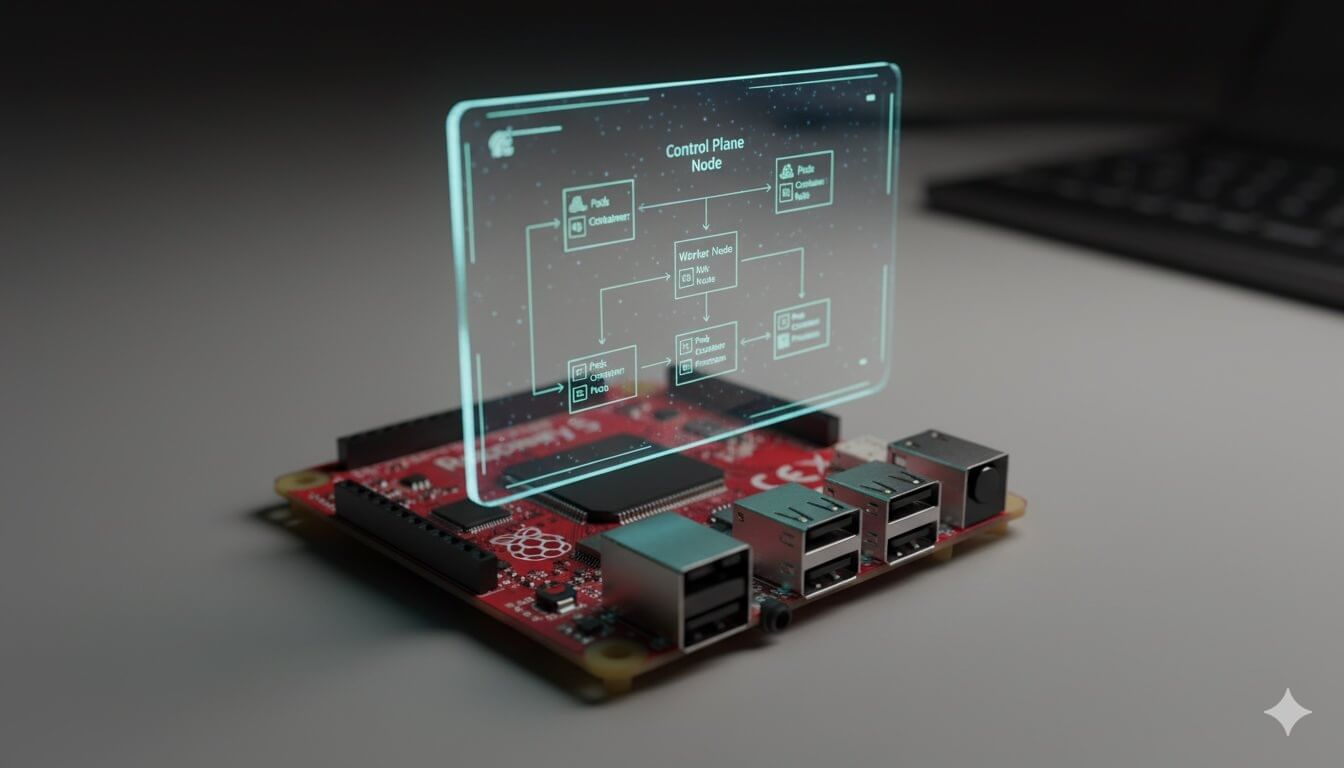
Now I’ve talked about this in a past video, but I have two “souped up” Raspberry Pi 5 devices running a Kubernetes cluster in my homelab.

My initial goal here was to use this as a place to practice, a place to experiment, a place to break things as I prep for the CKA certification. But it also has turned into much more than that.
I now have a legitimate domain for my homelab, dashboards, and alerts, and am working on a few apps to deploy that do random reporting around the house.
Again, in doing all this, I’ve come up with a base set of tools that should be in place to make everything in a Kubernetes cluster operate in a way that mimics what you may see out there in the real world.
If you are wondering how I set these up and how I’ve deployed them, take a look at my GitHub repo.
Here are 7 essential apps for your homelab Kubernetes cluster.
What are you even doing with your life 😂!? Go and check out my guide on buying and setting up your first Raspberry Pi 5 and get with the program.
Watch the Video?
Before we get started, if you prefer video, here you go:
Otherwise, continue reading.
1 - A Certificate Authority
Sure, since it’s a private home network, your apps can be insecure. You can use self-signed certificates, but since the whole point behind a homelab is for tinkering and learning, you might as well experiment with how to properly configure TLS certs and make sure all of your apps are secure in that way.
And my app of choice for this, in a Kubernetes cluster, is Cert Manager.
Cert manager deploys an Issuer in your cluster which is a resource that represents different certificate authorities (or CAs) that are able to sign certificates in response to certificate signing requests…which you create.
It can also renew that certificate in a window of time that you can set.
Here’s how it works…
For my home cluster, I have a Cloudflare domain called travismedia.cloud.
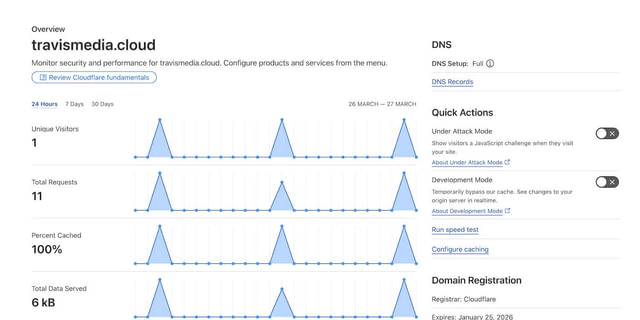
It has no access to the internet at all. There is no A record.
But with Cert Manager I can deploy a ClusterIssuer that can sign certificates from a slew of known issuers out there, including Acme, or Let’s Encrypt.
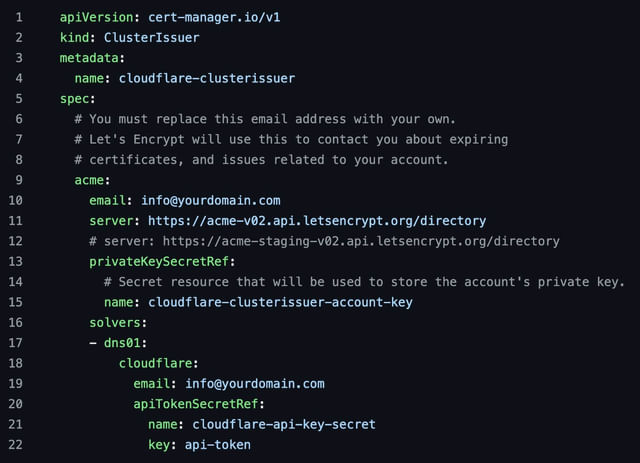
I then create a Certificate resource, the ClusterIsuer issues a DNS-01 challenge to verify that I own this domain, and it can do that because I supply it with a Cloudflare API key.
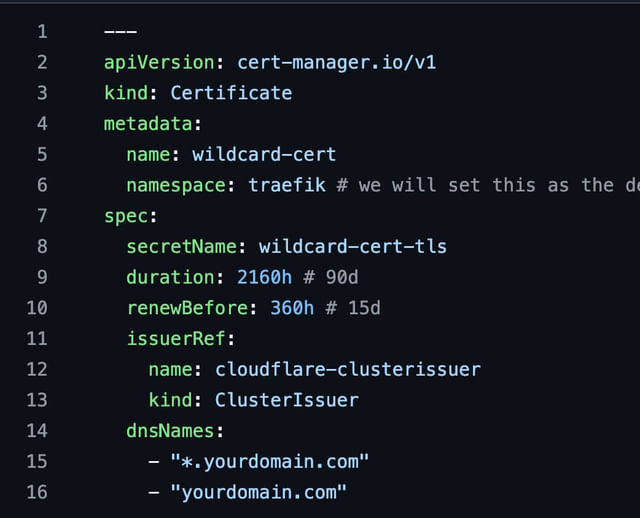
It then creates a TXT record, then lets the ACME server know to go and verify that that TXT record is there. Upon doing so it issues the certificate to Cert Manager who then handles the future renewal of it for me as well.
And in my cluster I’ve created one wildcard cert (*.travismedia.cloud) that works for ALL of my applications.
No insecure apps, and no self-signed certificates, but all my apps use travismedia.cloud and are served with a real TLS certificate issued by Let’s Encrypt.
Cert Manager is open-source and completely free.
2 - An Ingress Controller
Once you have a certificate authority in place, the next step is to manage how external traffic accesses your applications. This is where an Ingress controller comes into play. While Kubernetes provides the concept of Ingress resources, it doesn’t come with a built-in controller.
You’ll need a third-party solution, and two popular options are Nginx and Traefik.
Traefik serves a dual purpose: it acts as a reverse proxy and an Ingress controller. This means it can forward incoming requests to the appropriate backend services based on defined routes.
For example, if you have a Grafana application running on port 3000, Traefik can route requests coming to grafana.travismedia.cloud directly to that service.
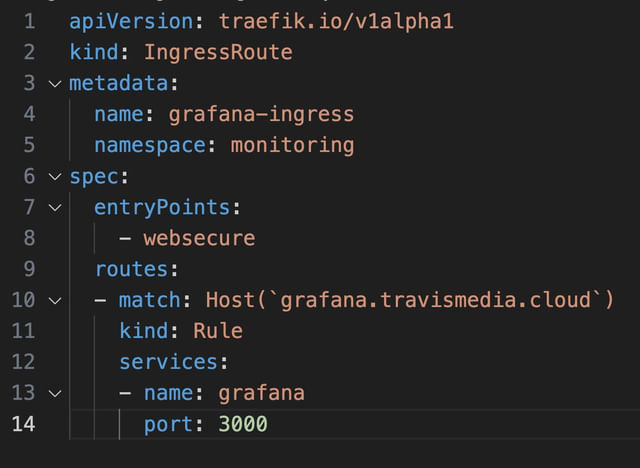
And set Traefik up effectively, you’ll need a load balancer. If your cluster runs on bare metal, deploying MetalLB can fulfill this requirement.
With Traefik and cert-manager working in tandem, you can easily manage TLS certificates for your services, enhancing both security and functionality.
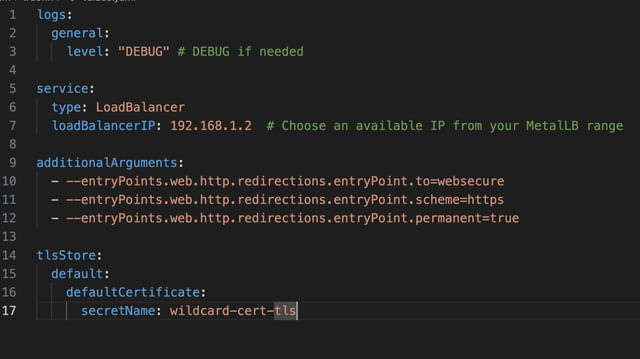
I’ve taken it a step further and declared my wildcard certificate as the default certificate in my Traefik configuration, and thus all my apps will use this by default.
3 - A Remote Access Solution
Next, accessing your home lab remotely without exposing your public IP is essential.
Traditional VPNs can be cumbersome and insecure, so I would suggest adopting a modern solution like Twingate.
This tool enhances security with a Zero Trust model, ensuring that each request within your network is verified.
And while setting up Twingate is already easy, I’ve decided to deploy their new Kubernetes operator in my cluster.
With this operator, you can manage access to your Kubernetes services declaratively.
For example, every morning my iPhone sends my daily steps to an API that I have running in my cluster. This gets recorded in Postgres and shows in a nifty Grafana dashboard.
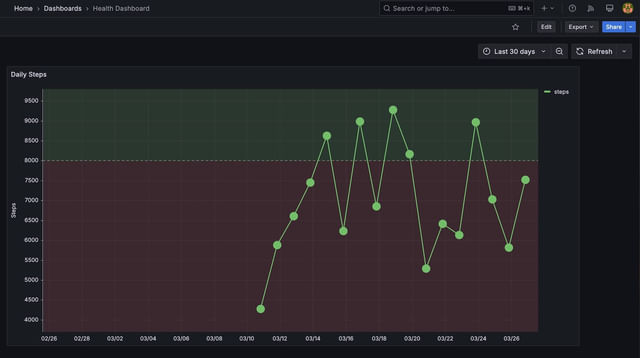
If I’m away from home and thus not on my network, the automation will fail. So I can use Twingate to quickly and securely connect to my home network and send the stats from anywhere in the world.
Additionally, Twingate enables you to grant granular access to other users, making it a versatile choice for family members or collaborators who need specific access to your resources.
Twingate is FREE to get started. Here’s a walkthrough I did on it not too long ago.
4 - A Central Dashboard
Once you get some apps deployed and some metrics displaying, you will need a central dashboard to access it all.
Perhaps you want to add dashboard links or bookmarks that you use regularly or set it up to be your main dashboard for everything you do at home!
It’s good to have a central place for everything…to have all of your services just a click away.
Now there are some great options out there like Heimdall, but I ended up going with Homepage.
I’m actually still working out how I want to lay this out and what I want to add to it (or remove), but I have included many links that I visit on a regular basis and can use this custom dashboard as my default browser homepage.
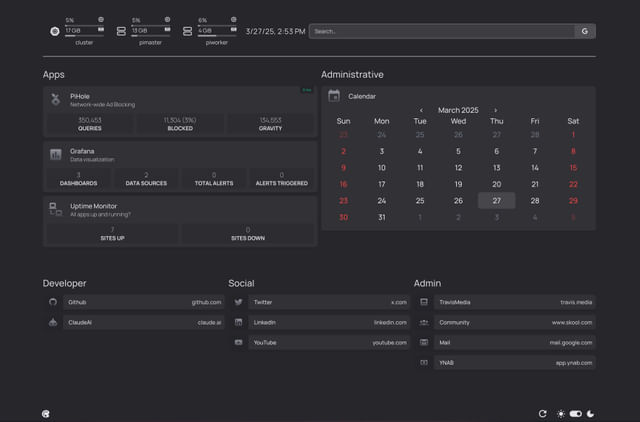
There are dozens of preconfigured widgets to use, custom API widgets for any API data you want, and can be tweaked in a myriad of ways.
5 - Metrics and Observability
Every home lab needs a solid observability platform. This is critical for understanding how your applications and infrastructure are performing. You can’t manage what you can’t measure, right?
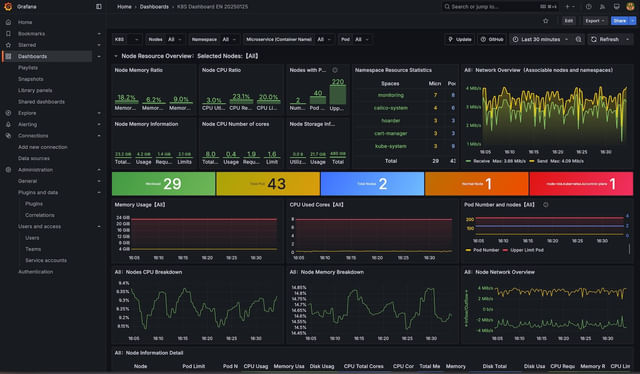
This is where Grafana and Prometheus come into play.
Grafana serves as a powerful visualization tool. It can display metrics collected from various sources, giving you a comprehensive view of your system’s health.
To gather these metrics, you can use Prometheus, which collects and stores time series data that can then be used as a data source in Grafana.
Prometheus scrapes metrics at defined intervals, allowing you to monitor things like CPU usage, memory consumption, and more.
6 - A Database
Time-series data can add up quickly and you’ll probably not want to keep it for too long.
For data you want to keep longer, consider a relational database such as PostgreSQL.
Using the Bitnami Helm chart for PostgreSQL makes deployment straightforward. You can configure options like automated backups and metrics collection with Prometheus during the setup. This ensures that your data is not only safe but also available for monitoring.
As you build out your applications, having a structured database allows you to manage data efficiently. For example, if you’re developing applications that track home automation metrics, setting up tables in PostgreSQL to store this data is vital.
Moreover, you can easily add your PostgreSQL instance as a data source in Grafana. This integration allows you to visualize and analyze your database’s performance metrics, ensuring that your applications run smoothly.
7 - An Uptime Monitoring Solution
Monitoring your applications for uptime is crucial. You want to know when something goes down before your users do.
And for this, I use Uptime Kuma.
Uptime Kuma provides an intuitive interface to monitor your applications and services. You can easily set up checks for each of your applications, specifying intervals and alert conditions. If something goes down, you can receive notifications, allowing you to react promptly.
Additionally, Uptime Kuma can monitor the expiration status of your TLS certificates. This is particularly useful for ensuring that your applications remain secure and accessible.
You can even create a status page that provides an overview of your services, which can be linked to your central dashboard.
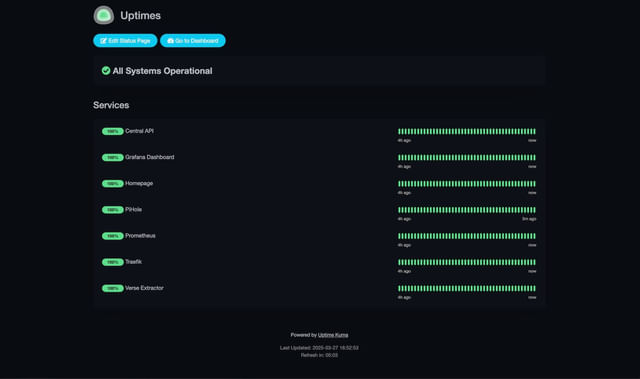
Deploying Uptime Kuma is straightforward. Just specify the necessary volume for storage in the Helm chart, and you’re good to go. With this tool in place, you can focus on building and improving your applications, knowing that you’ll be alerted if anything goes awry.
Two Runner-Up Apps
While the seven tools mentioned are essential, I have a couple of runner-up applications that may enhance your home lab experience.
- GitOps Workflow: Consider integrating a GitOps tool like Argo CD. This setup ensures that your Kubernetes applications are always in sync with your version-controlled configurations. Any changes you commit to your Git repository automatically trigger deployments in your cluster, maintaining consistency.
- Better Storage Solutions: Currently, I’m looking into options like Longhorn for persistent storage solutions. This would allow for better management of your Kubernetes volumes, providing redundancy and easier backups. Syncing to S3 with MinIO is also an option worth exploring.
Conclusion and Discussion
Building a home lab Kubernetes cluster is an exciting venture filled with learning opportunities. The tools outlined in this guide provide a solid foundation for creating a robust environment that simulates what you may see in real-world scenarios.
From securing your applications with a certificate authority to monitoring their performance, each tool plays a crucial role in your home lab’s success. As technology evolves, so will your setup. Don’t hesitate to experiment with new tools and techniques.
What tools do you find essential in your home lab?
Are there any applications you’d recommend that I didn’t mention?
Let’s keep the conversation going in the comments below.
This page may contain affiliate links. Please see my affiliate disclaimer for more info.
